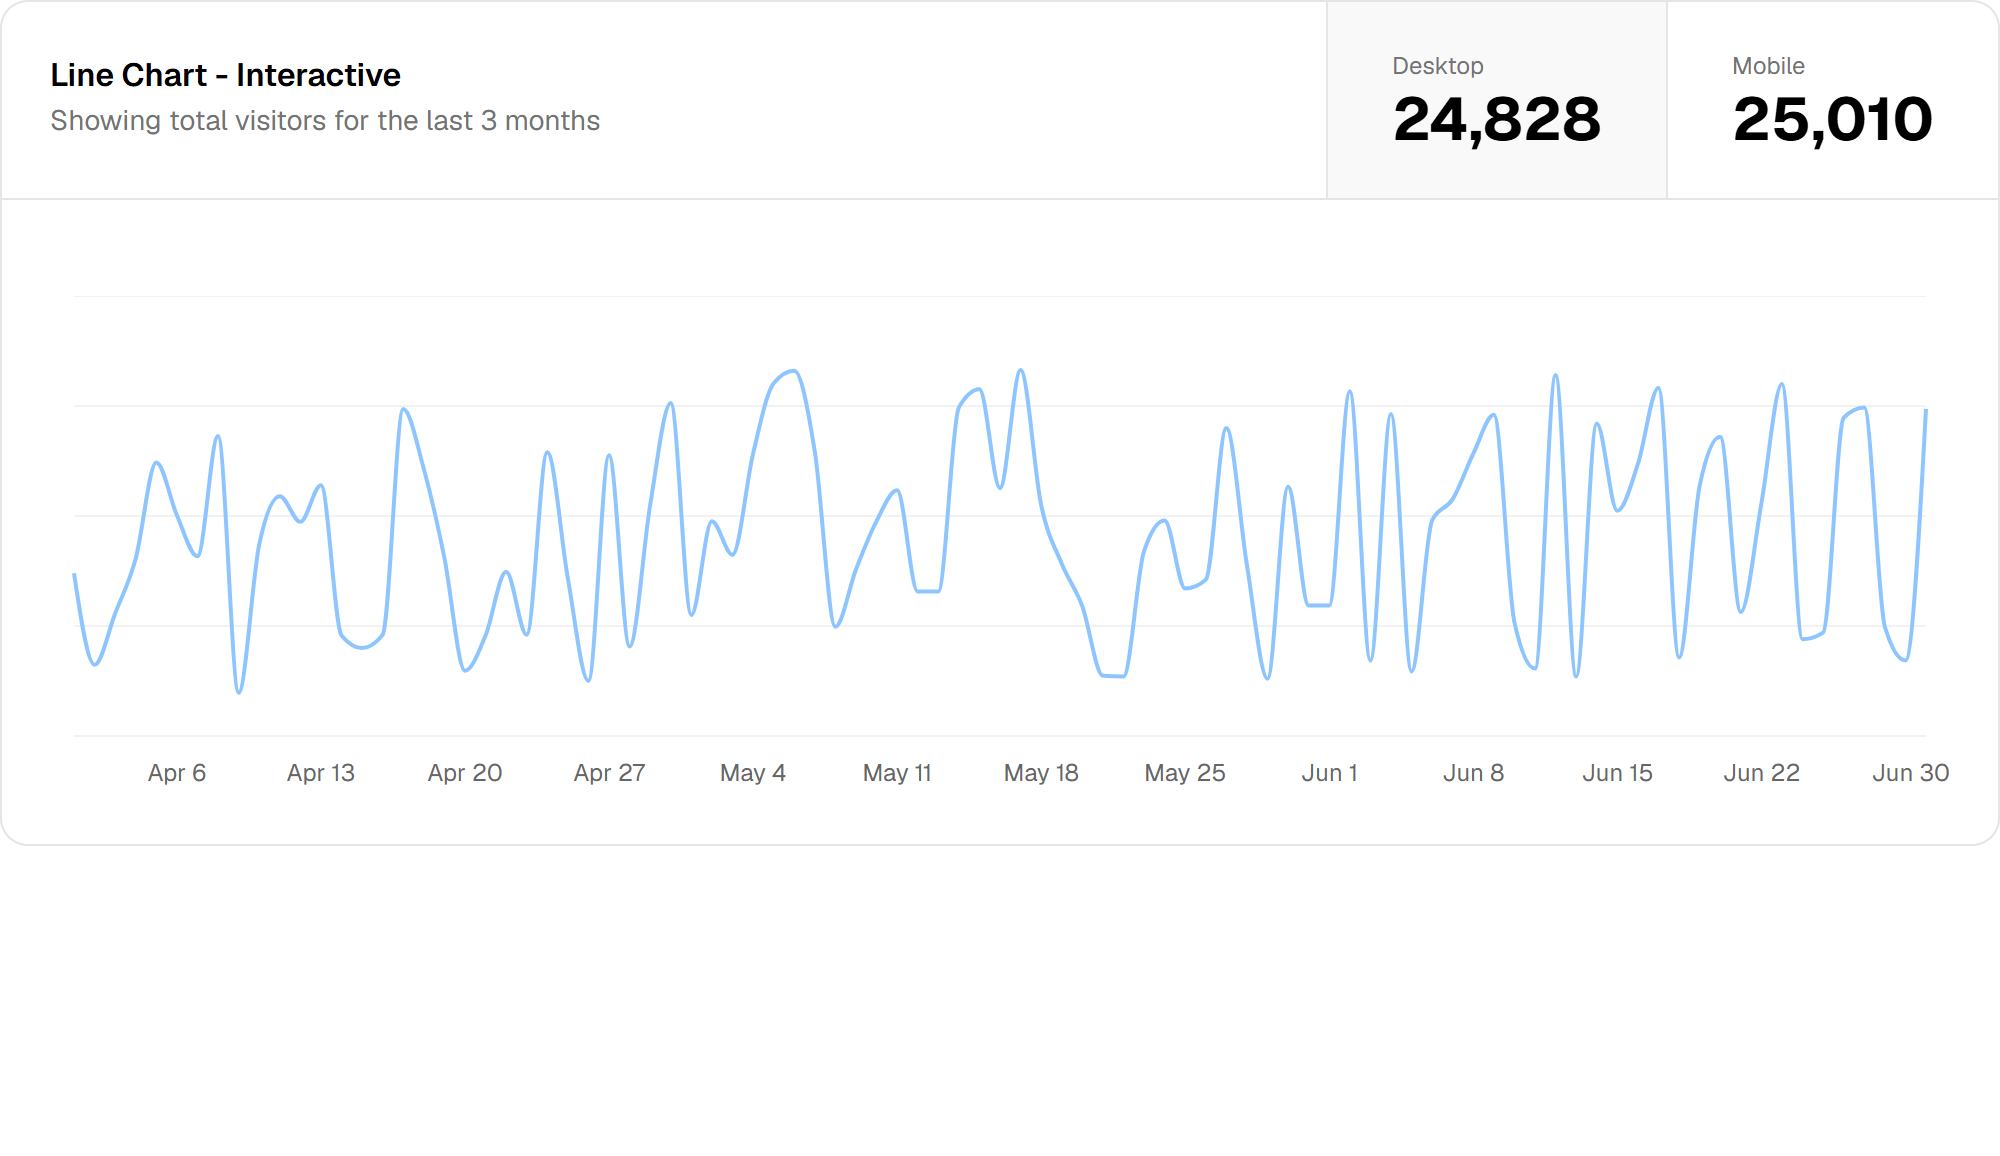
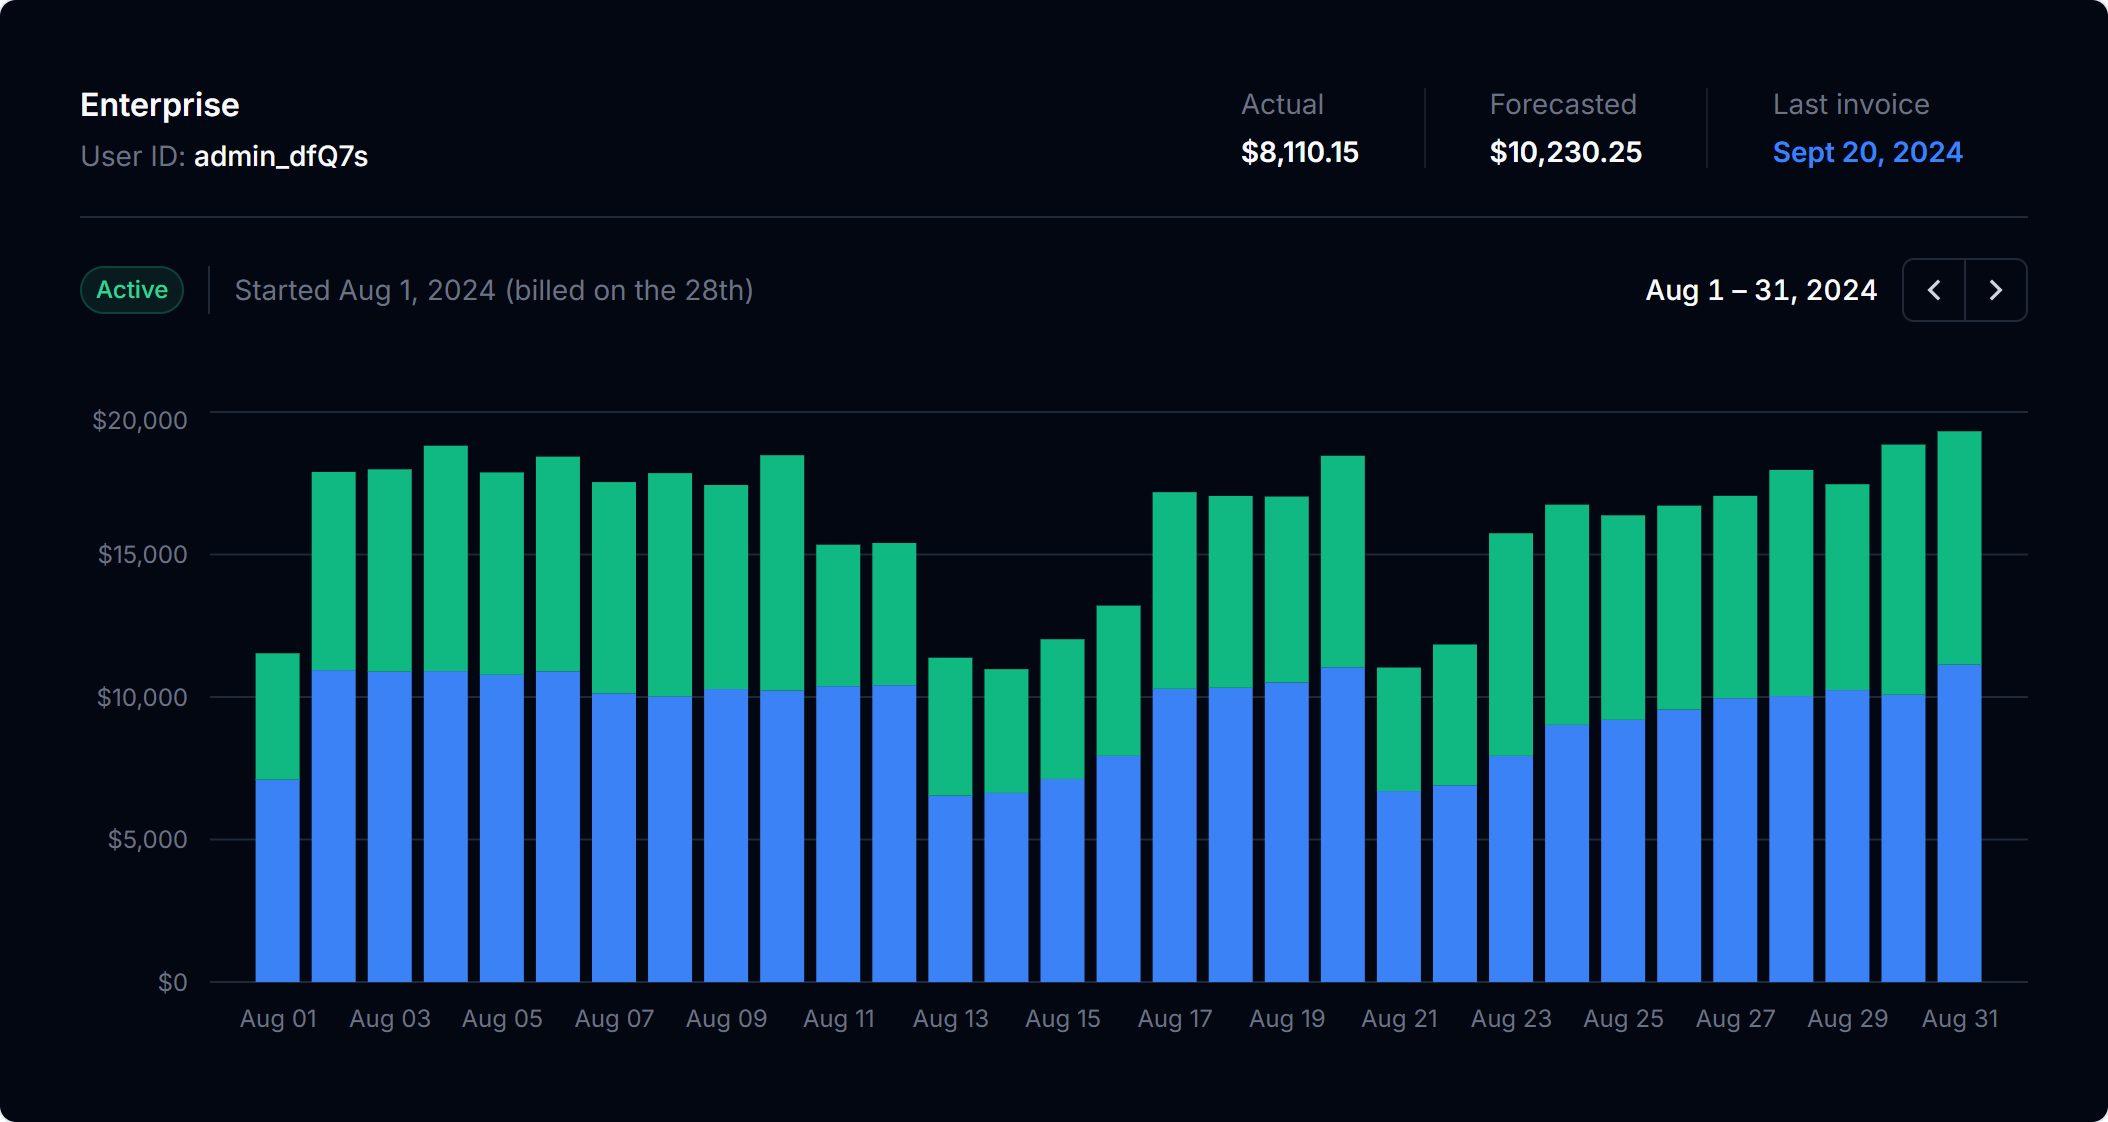
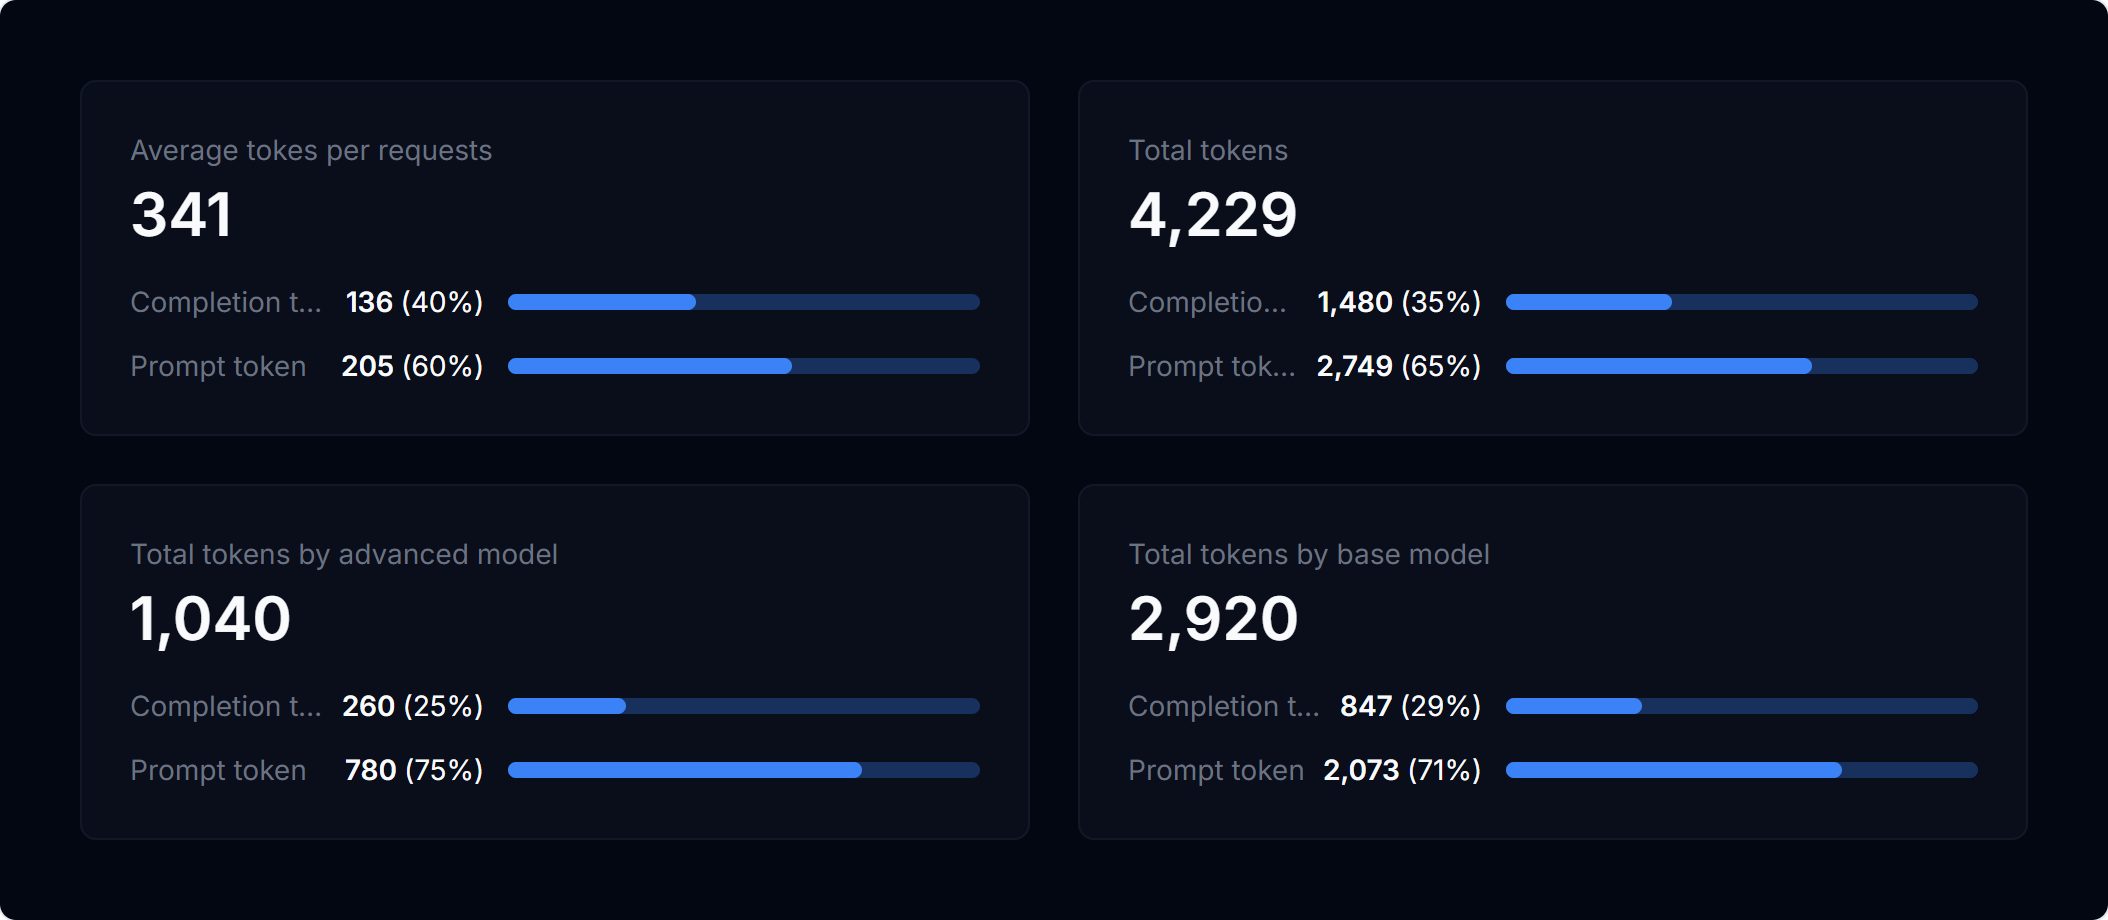
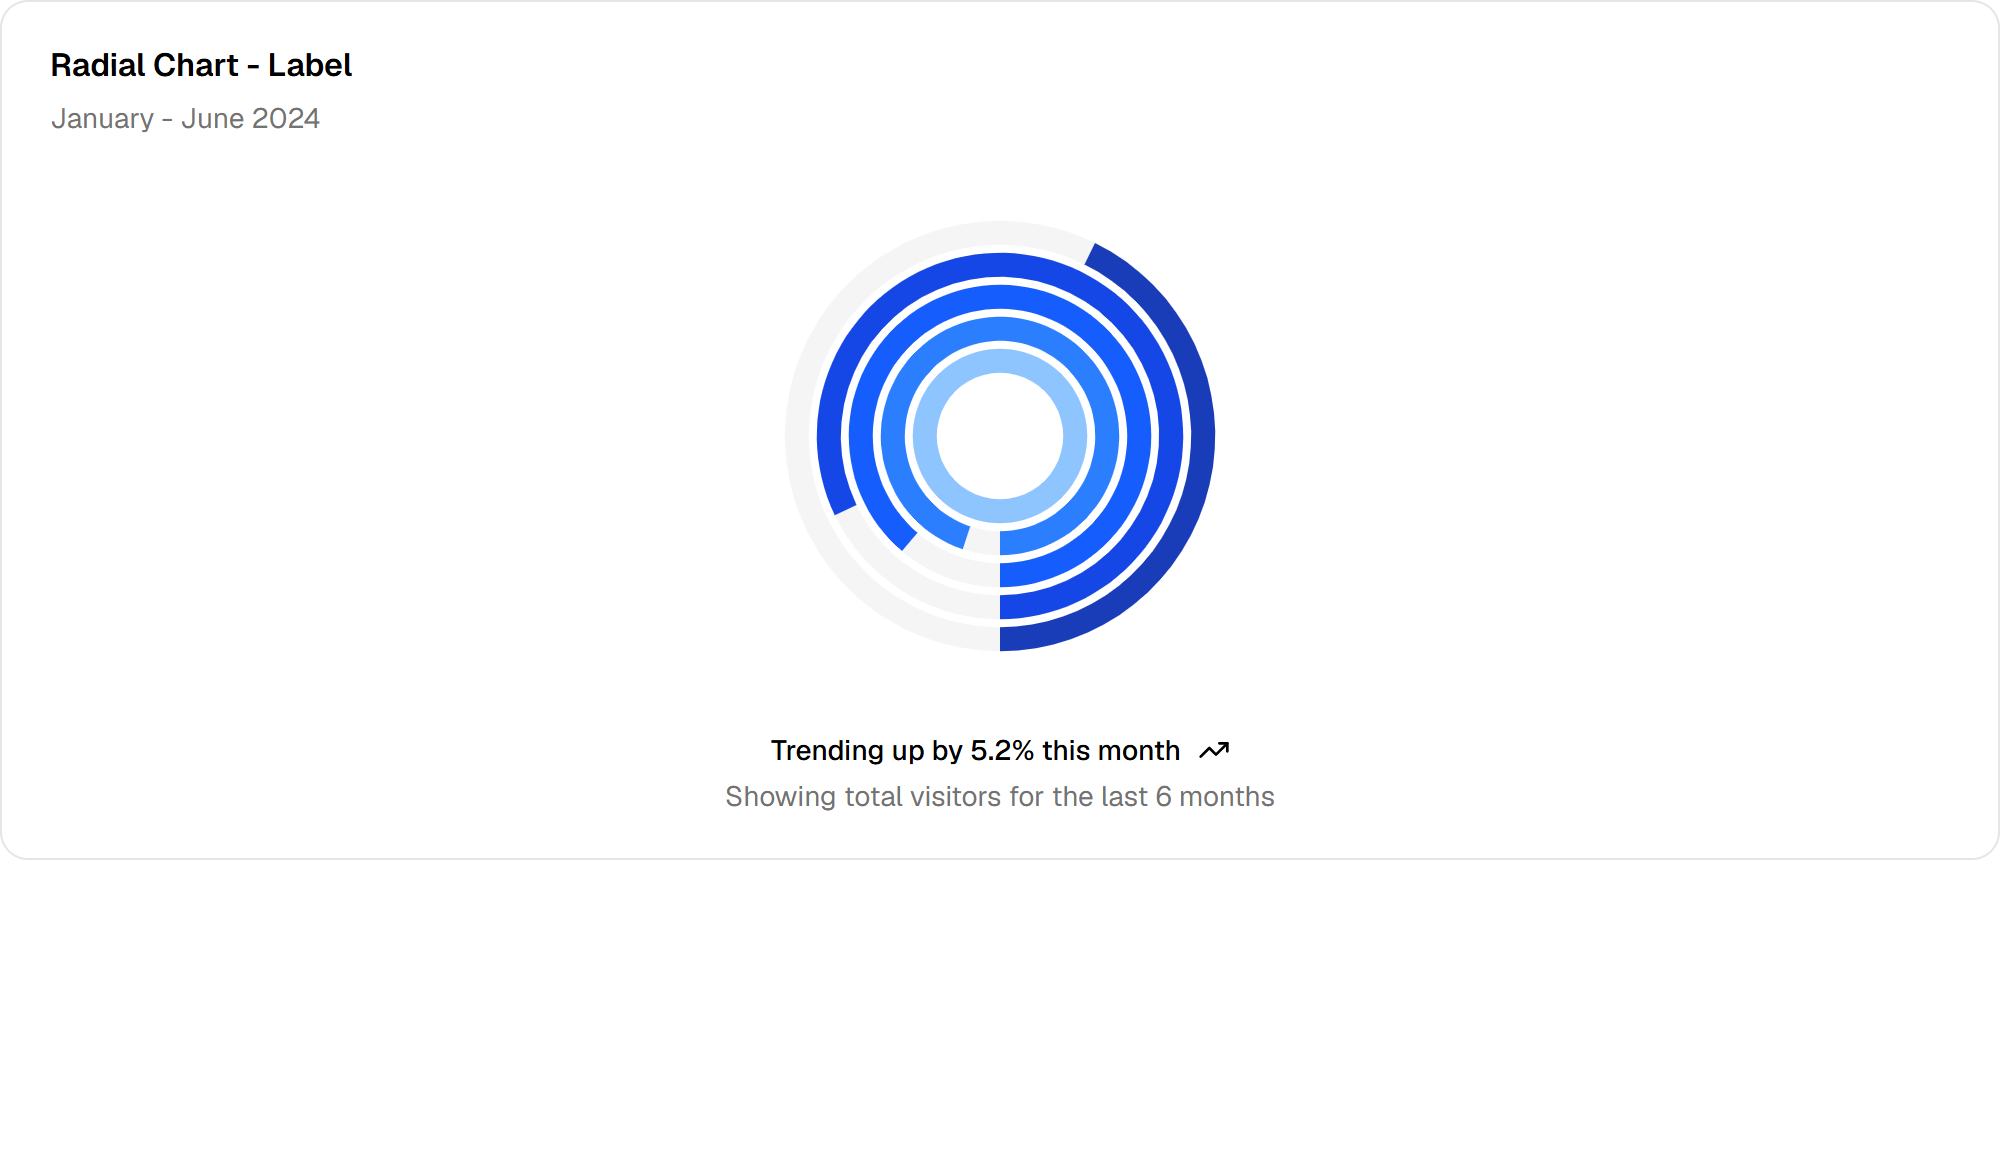
Analytics chart
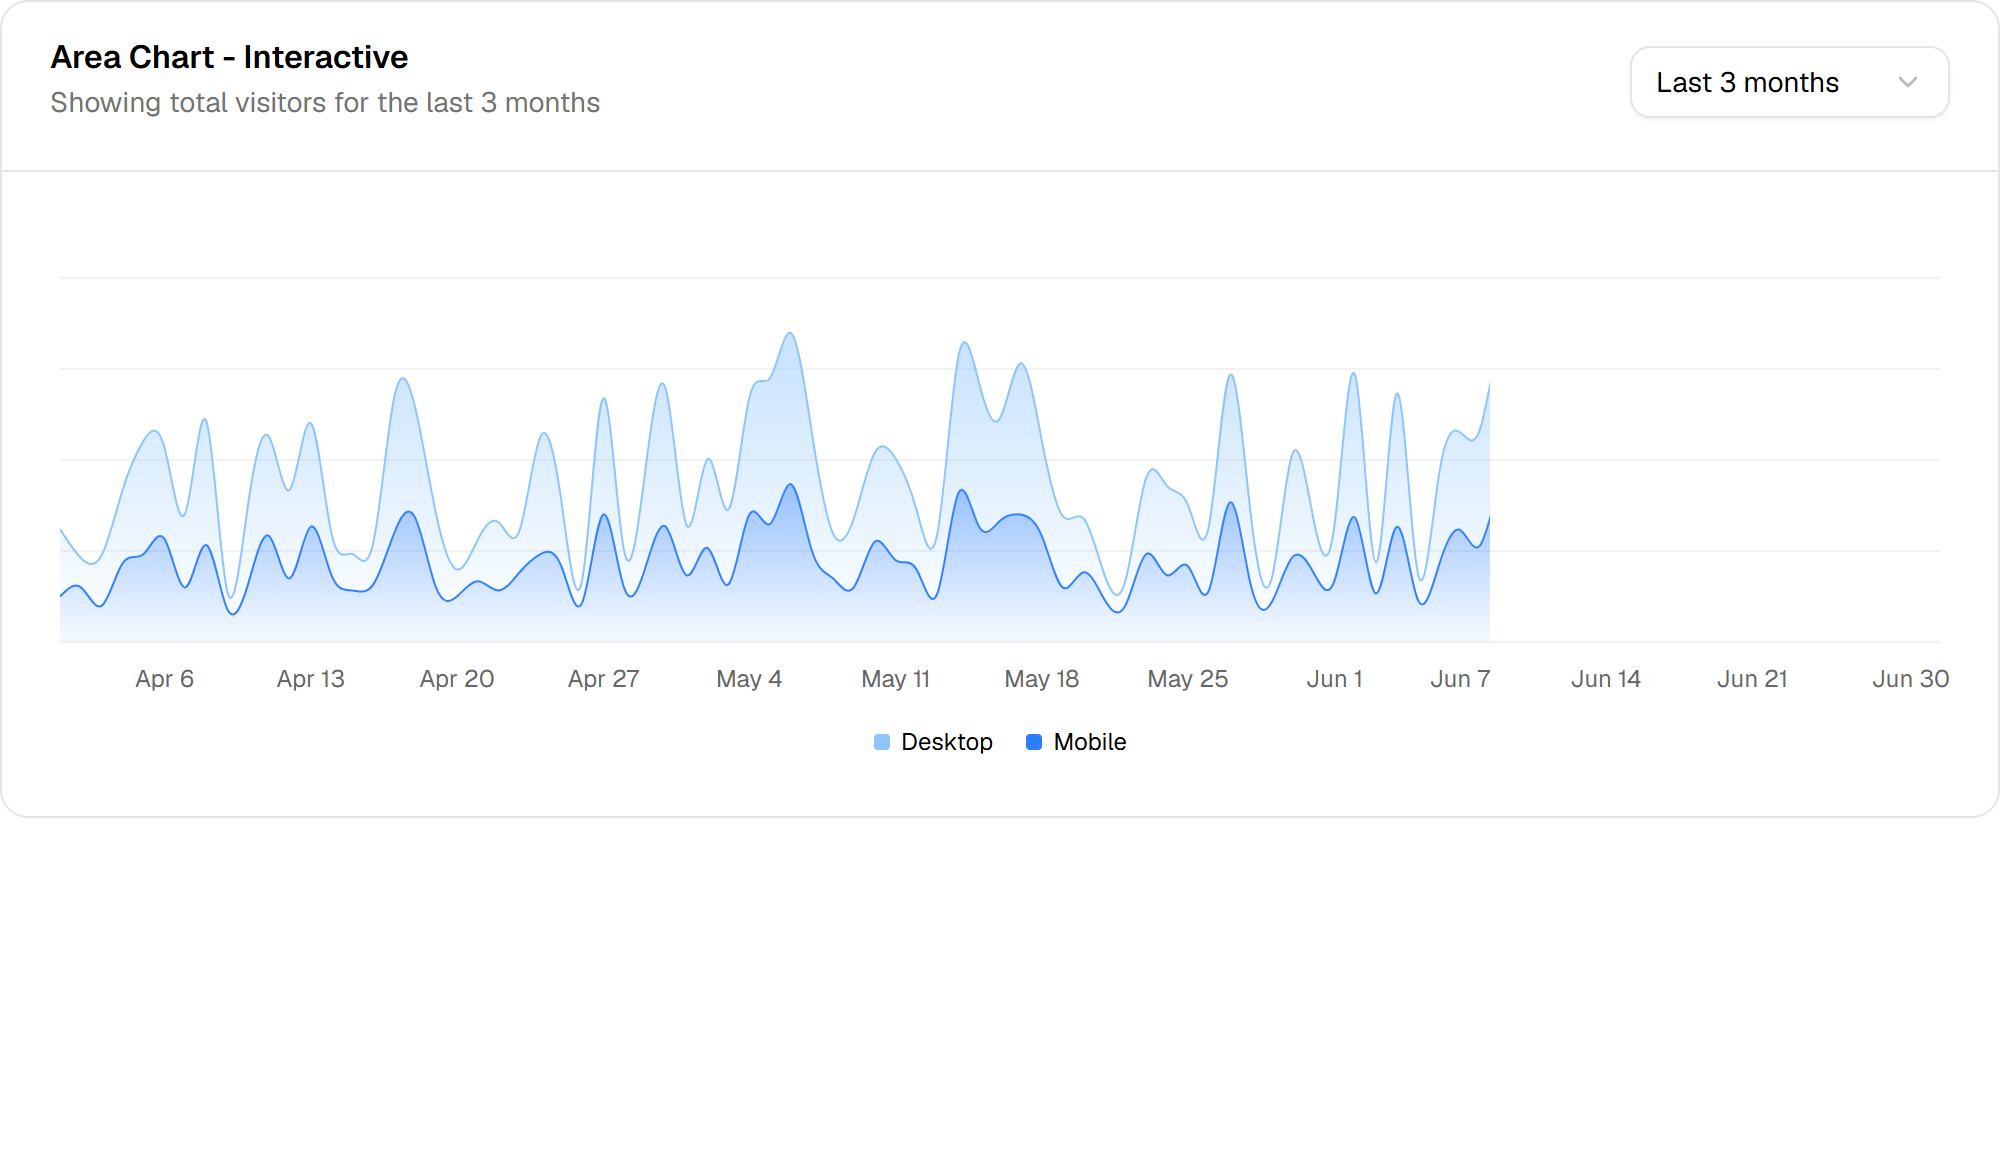
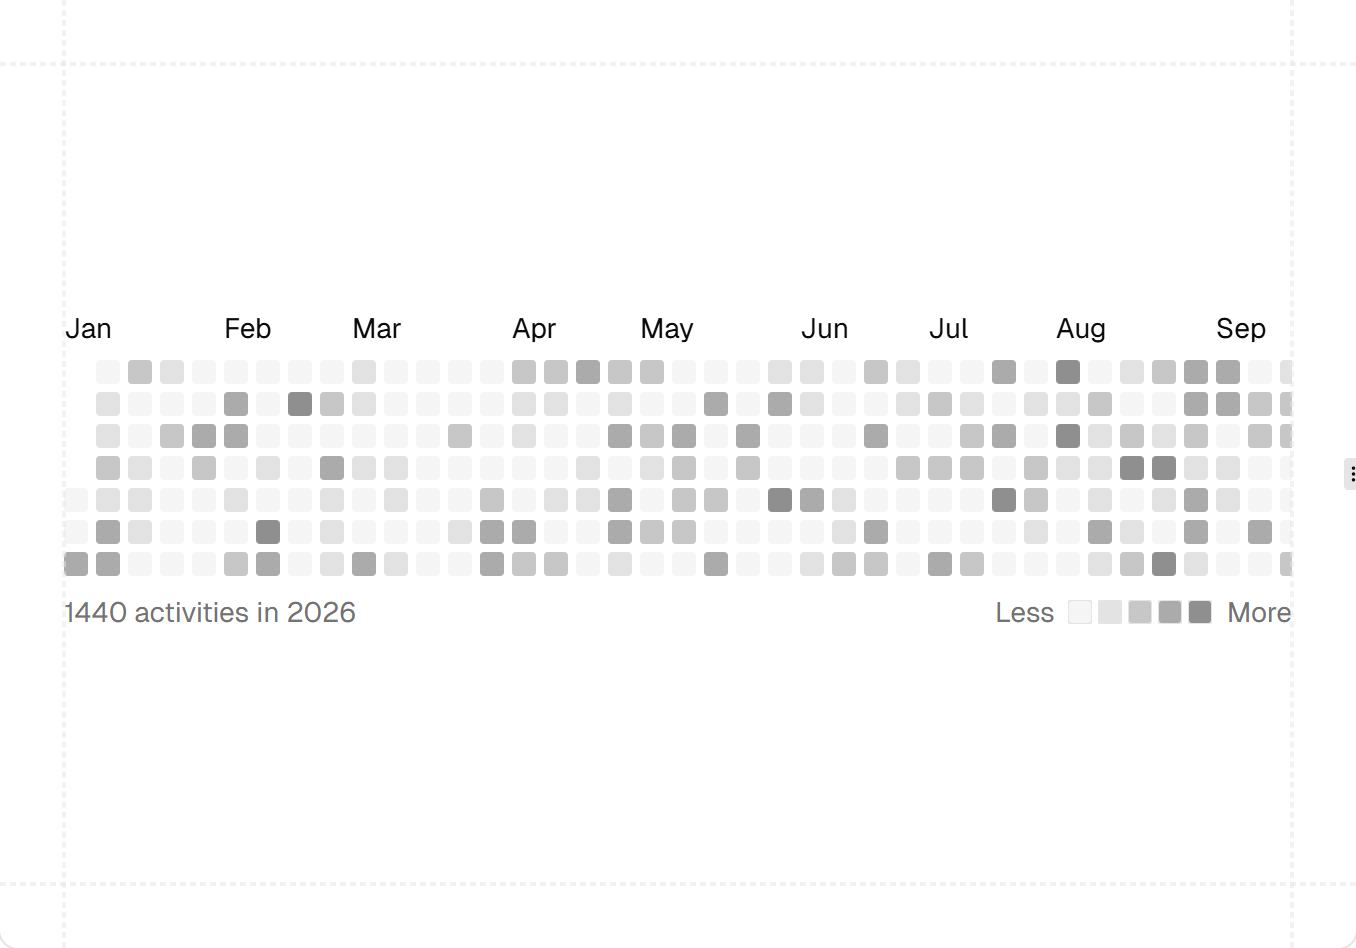
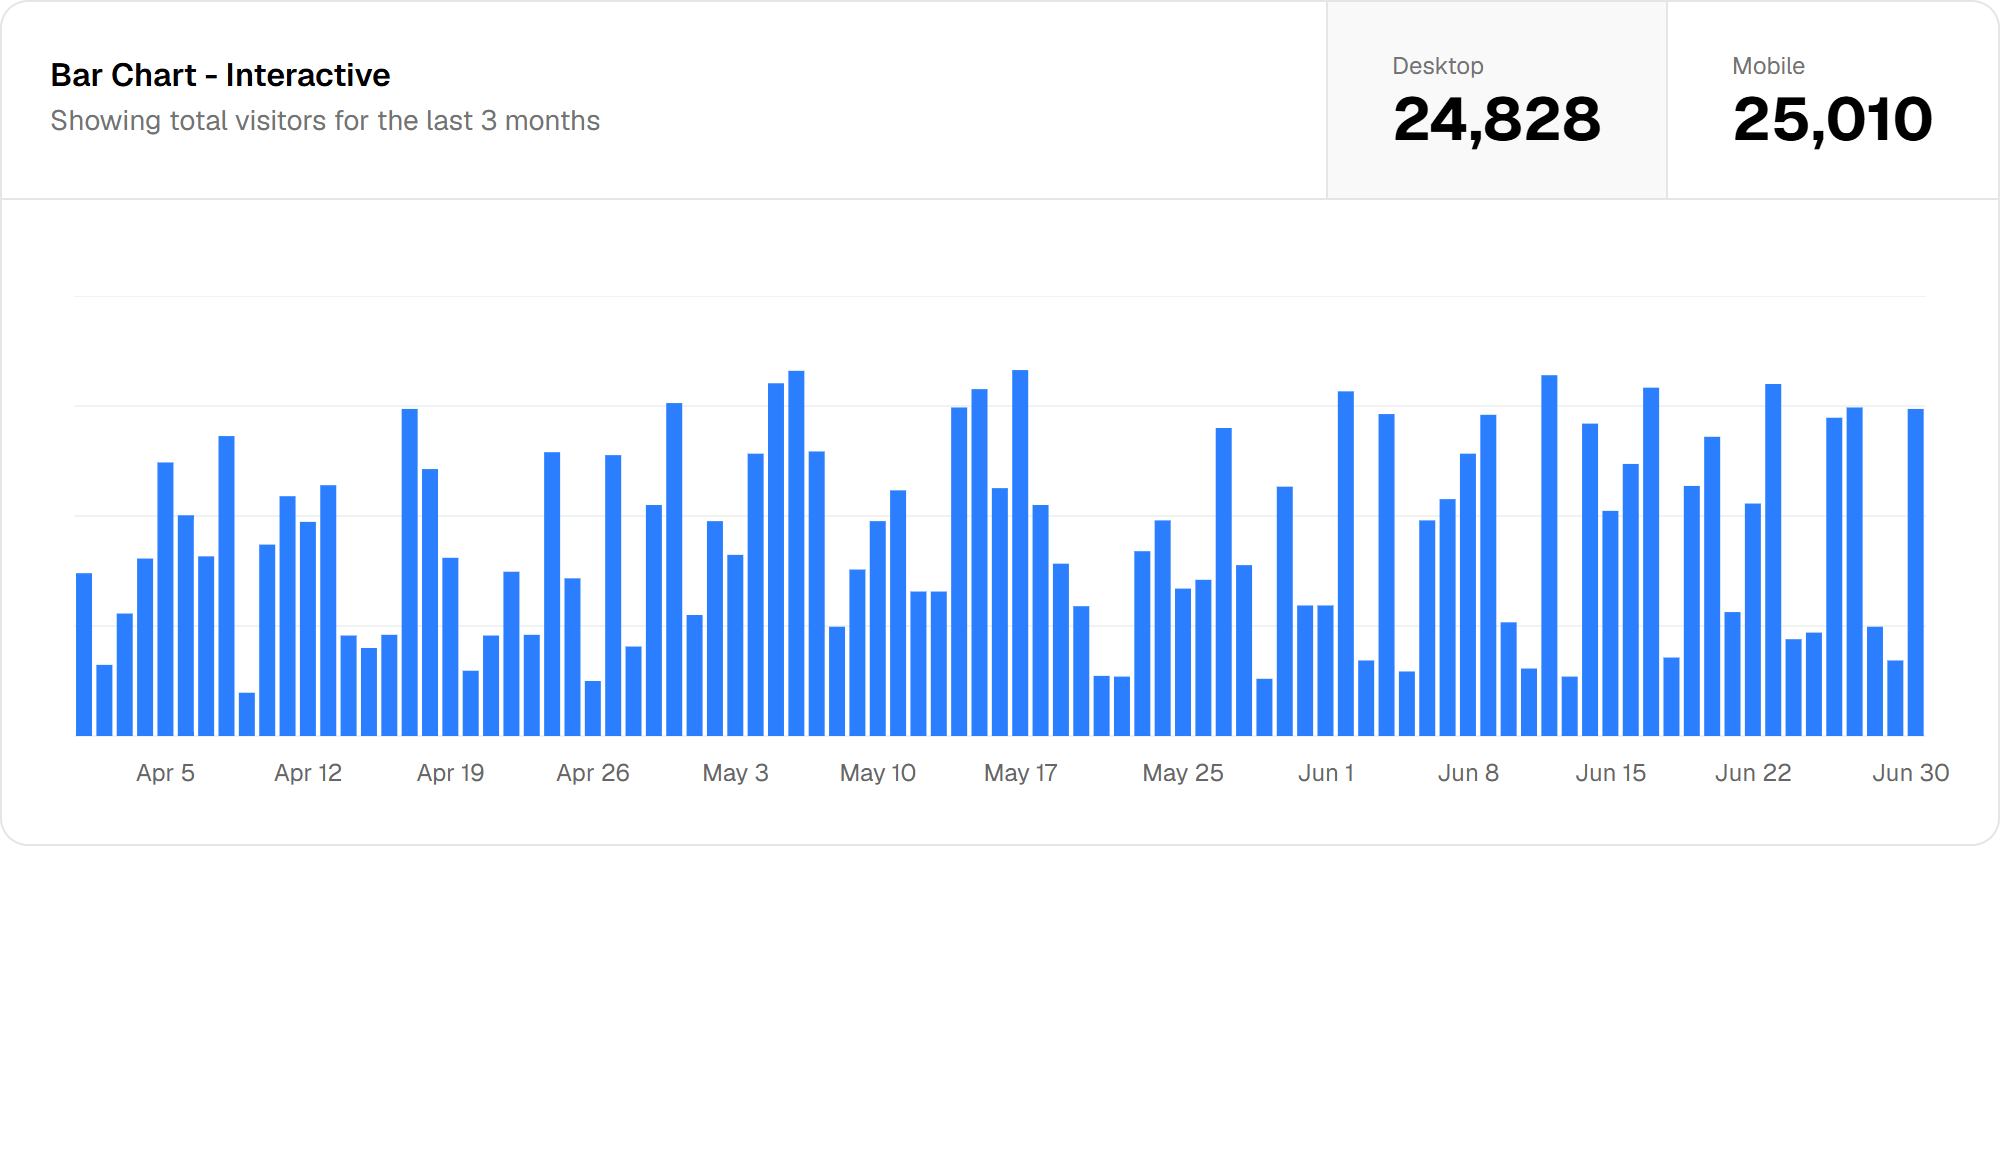
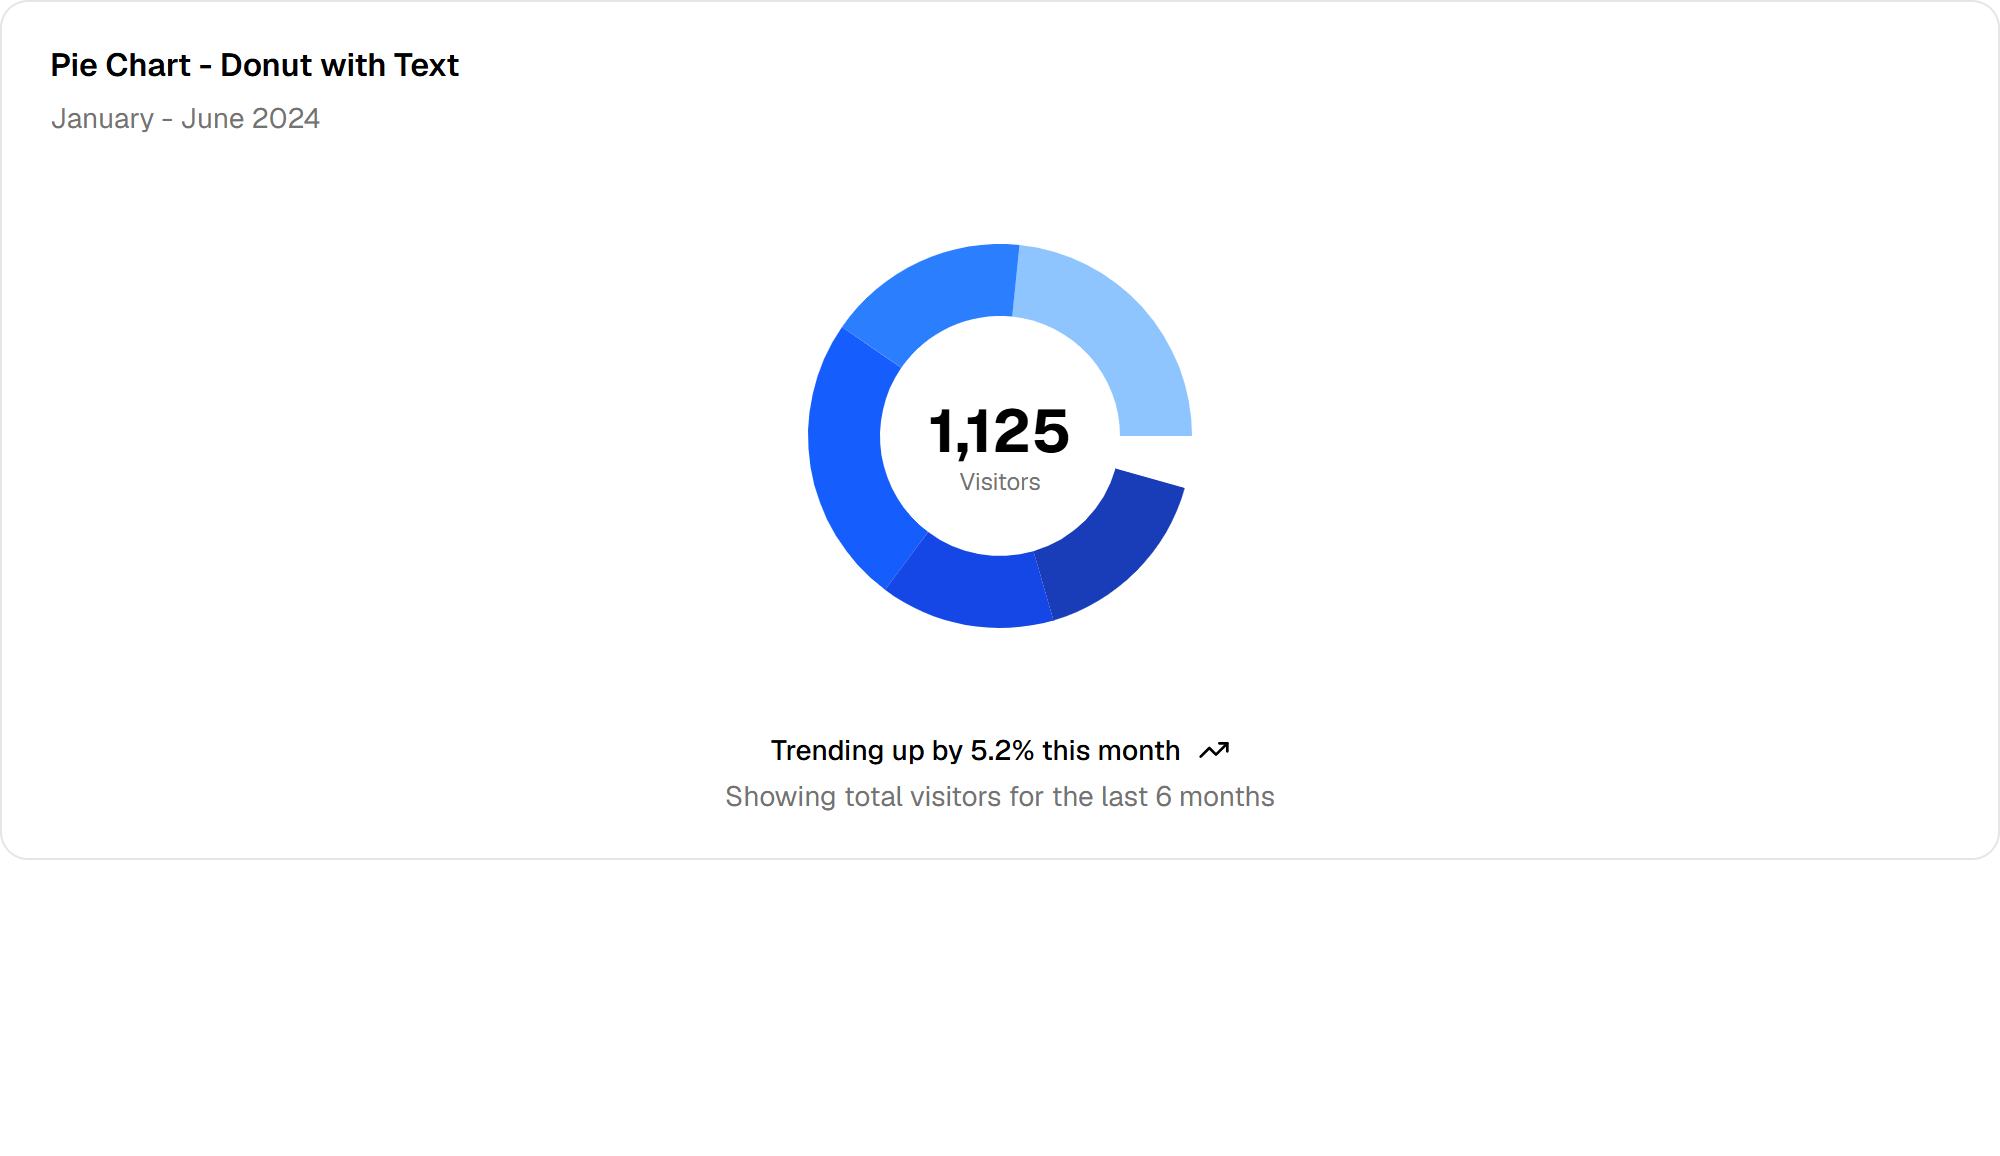
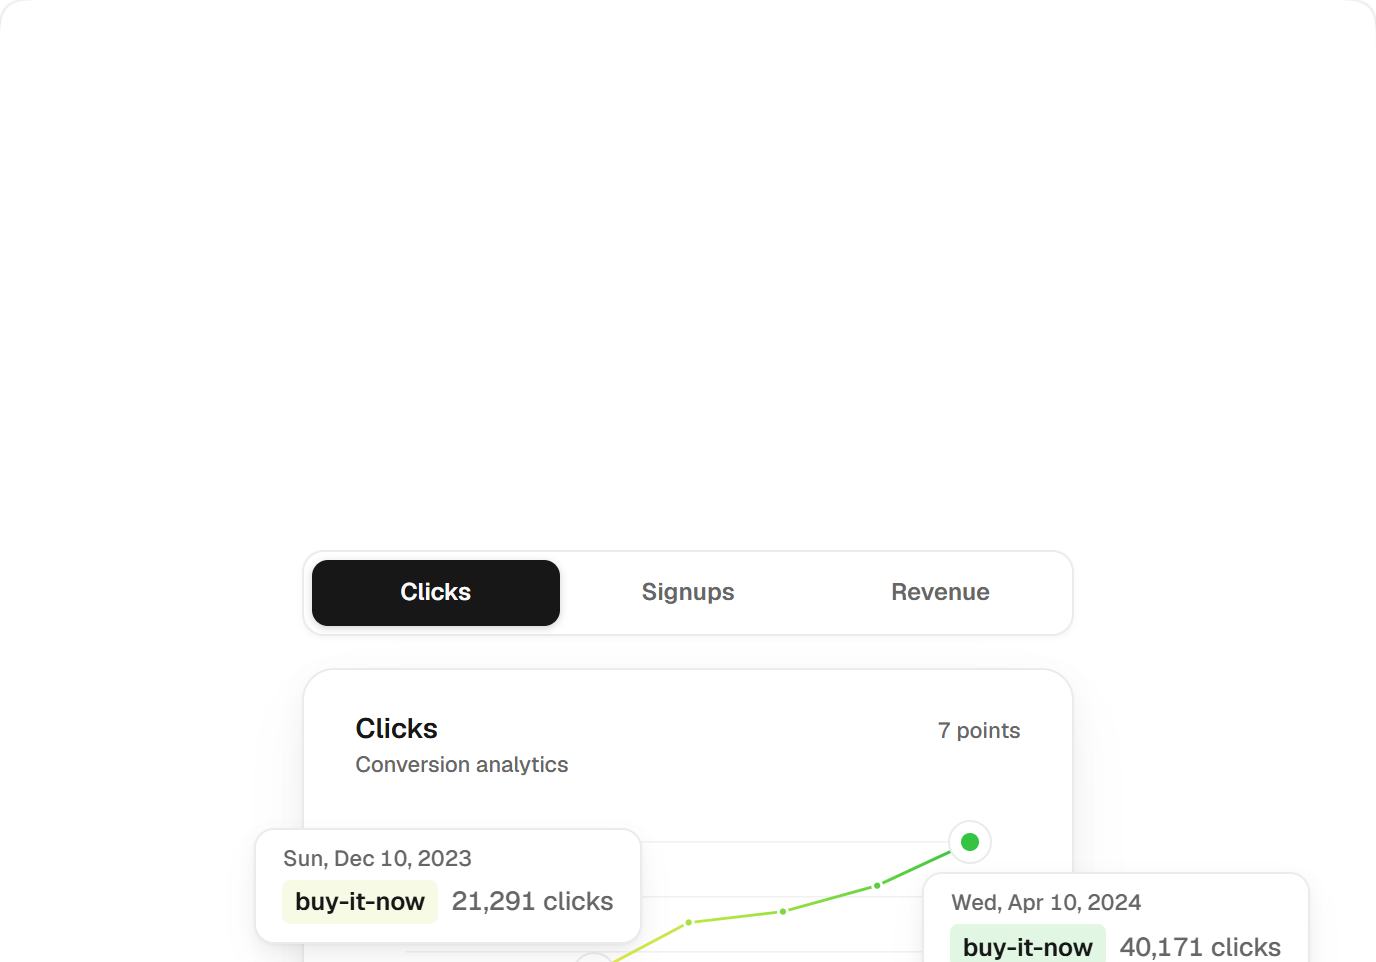
Analytics chart is a charts component for React and Tailwind CSS. Included in SexyUI Pro, a one-time purchase.
About charts
Charts turn numbers into pictures: area, bar, line and pie charts, heatmaps, gauges and activity rings. Every SexyUI component is written for React and Tailwind CSS, follows shadcn/ui conventions, lists its dependencies, and ships with its original MIT licence notice.
Use it with a coding agent
Your agent can fetch this component as markdown in one request: GET /api/components/analytics-chart?format=md with your license key in the Authorization header. See llms.txt.